
Measure OEE losses before you buy new equipment
A loss baseline tells you whether you need a new machine, a retrofit, or better changeovers. It is the cheapest engineering study a plant can run.
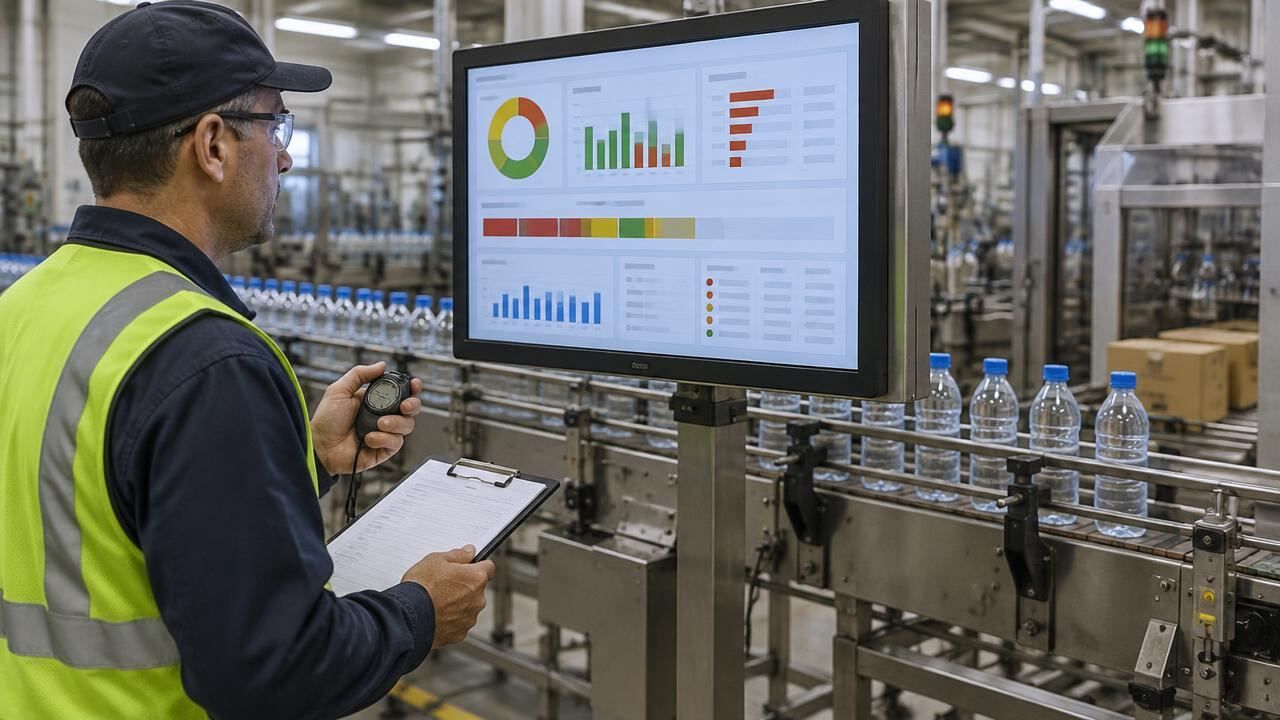
OEE = Availability × Performance × Quality, measured against planned production time. Break each factor into named losses (breakdowns, changeovers, minor stops, slow running, start-up rejects, process rejects), record them for at least several weeks, and fix the largest loss on the constraint step first. Buy capacity only for the gap that remains after realistic loss reduction.
Who is asking — and what each role should check first
| Role | Their question | Start with |
|---|---|---|
| Owner / managing director | Is this worth the capital and the disruption risk? | Payback range, downside case, and what happens if we do nothing. |
| Operations / plant manager | Will this fix the losses I see every shift? | Loss baseline by category and the shutdown window the plant can afford. |
| Engineer / maintenance | Can it be integrated, maintained and made safe? | Interfaces, utilities, controls obsolescence and the safety re-assessment. |
| Purchasing | Are we comparing offers on the same scope? | One written requirement, a normalised scope matrix and acceptance terms. |
| Consultant / advisor | Is the business case built on measured data? | Data quality, assumptions register and sensitivity on the key drivers. |
What OEE measures — and what it does not
OEE shows how much of the planned time on one asset or line produced good output at the ideal rate. It does not show whether that asset is the plant's constraint.
Run time ÷ Planned production timePlanned production time excludes scheduled no-production periods; define them once and keep them fixed.
(Ideal cycle time × Total count) ÷ Run timeUse the validated ideal cycle time for the product, not the nameplate maximum of a different format.
Good count ÷ Total countCount rework as not-good at first pass, or the losses disappear from the data.
Availability × Performance × Quality = (Good count × Ideal cycle time) ÷ Planned production timeISO 22400-2 defines comparable KPIs; agree one definition across sites before benchmarking.
Turn the OEE number into a loss tree
A single OEE percentage is not actionable. A ranked list of losses in hours or units is.
| Loss | OEE factor | Typical evidence | Usually first fix | Equipment spend justified when |
|---|---|---|---|---|
| Breakdowns | Availability | Repeat failure codes, MTBF trend | Root cause + preventive maintenance | Failures trace to wear or obsolete parts |
| Changeovers / setups | Availability | Setup time per format | SMED-style setup reduction | Tooling or format parts are the limit |
| Minor stops / jams | Performance | Short stops < 5 min per hour | Infeed, sensors, material spec | Mechanism design causes the jams |
| Reduced speed | Performance | Actual vs ideal rate | Recipe and upstream supply check | Drive, servo or controls cannot hold rate |
| Start-up rejects | Quality | Rejects after each start | Warm-up procedure | Process control cannot stabilise |
| Process rejects | Quality | Reject causes by shift | Inspection + material control | Precision or sealing capability is short |
How much data is enough
- Cover every product format and shift pattern that matters — several weeks is a practical minimum; a full product cycle is better.
- Use reason codes the operators can actually choose in under five seconds; too many codes produce 'other'.
- Reconcile counts with dispatched good output weekly, so the data is trusted by finance.
- Record the step that was starved or blocked, not just the step that stopped.
Size the upgrade from the remaining gap
Required capacity gap = target good output − (current good output after realistic loss reduction).
Planned time × Ideal rate × (Target OEE − Current OEE)Use a target you can defend from your own best sustained weeks, not an industry headline.
| Item | Value |
|---|---|
| Planned time per year | 5,000 h |
| Ideal rate | 3,000 units/h |
| Current OEE | 55% → 8.25 M good units/yr |
| Best sustained 4 weeks | 65% → 9.75 M good units/yr |
| Demand target | 11.0 M good units/yr |
| Gap after loss reduction | 1.25 M units/yr — this, not 2.75 M, is what new capacity must cover |
Mistakes to avoid
- Comparing OEE across plants that define planned time differently.
- Buying a faster machine for a step that is not the constraint.
- Using supplier nameplate speed as the ideal cycle time in the business case.
- Ignoring ramp-up: a new or retrofitted asset rarely reaches target in the first weeks; put a ramp-up curve in the ROI model.
Frequently asked questions
What is a good OEE?
There is no universal good value; it depends on product mix, changeover frequency and how planned time is defined. Compare a line against its own best sustained performance and against the output it must deliver.
Should I calculate OEE per machine or per line?
Both. Line OEE shows delivered performance; machine-level data shows which step causes the losses. Upgrade decisions should be made at the constraint step.
Can OEE justify buying a new machine?
Only indirectly. OEE shows where time is lost. Investment is justified when the remaining gap after realistic loss reduction still prevents you from meeting demand or cost targets.
Request a line upgrade assessment
Share your loss data or current output and target. The team reviews it as an upgrade of an existing line. Planning guides and calculators are free; supplier outreach applies to qualified projects of USD 250,000 or more.
Start the requestRelated guides and tools
- Existing operations hub
- Retrofit or replace? Deciding what to do with equipment you already own
- How to expand capacity without stopping production
- How to compare factory automation companies for an existing-plant upgrade
- Factory automation systems for existing plants
- Industrial plant problems: symptom-to-cause guide
- Expand capacity or remove the bottleneck first?
- Fix, expand or build new — a CAPEX decision framework
- Upgrade vs expand vs new production line
- Phased automation upgrades: cost and downtime risk
- CAPEX/OPEX/ROI scenarios from your operating data
- Payback and IRR calculator
- Diagnose downtime, quality and cost trends
Sources and references
- ISO 22400-2:2014 — KPI definitions for manufacturing operations management, including OEE index.
- Nakajima, S. — Introduction to TPM (1988) — Origin of the six big losses grouping used above.
- Goldratt, E. — The Goal (1984) — Theory of constraints: throughput is limited by the constraint step.
Example figures are hypothetical and illustrate method only; they are not client results or price quotes.